Appearance
Dashboard
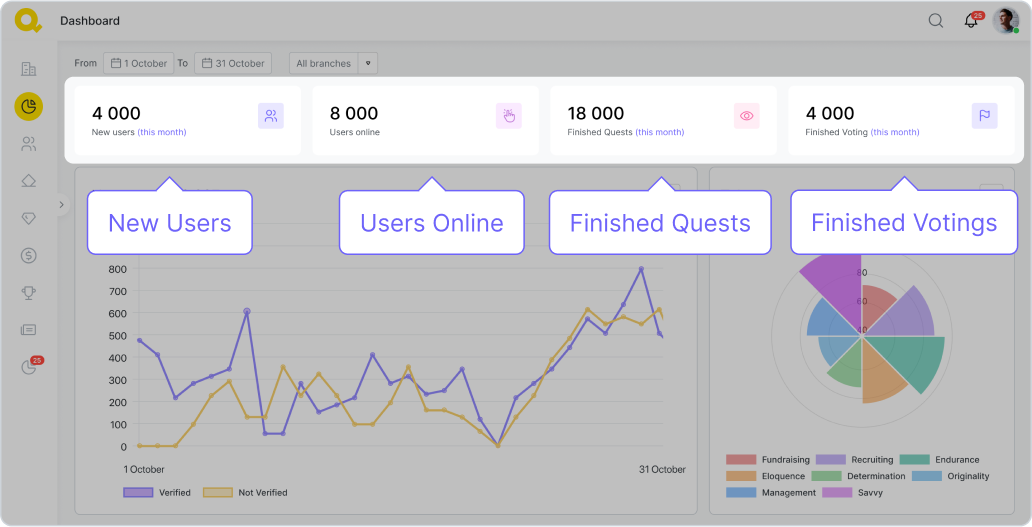
You can choose a time period for the data that you want to see in the top left corner of the page. The meters show information about the number of new users, the number of users online at the moment, and the number of quests and votings that were completed over the last month.
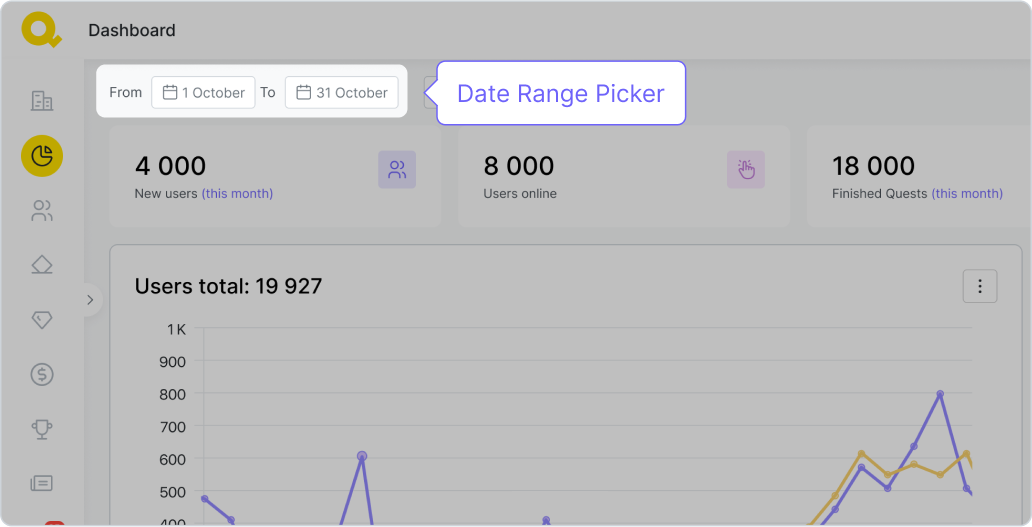
The meters show information about the number of new users, the number of users online at the moment, and the number of quests and votings that were completed over the last month.
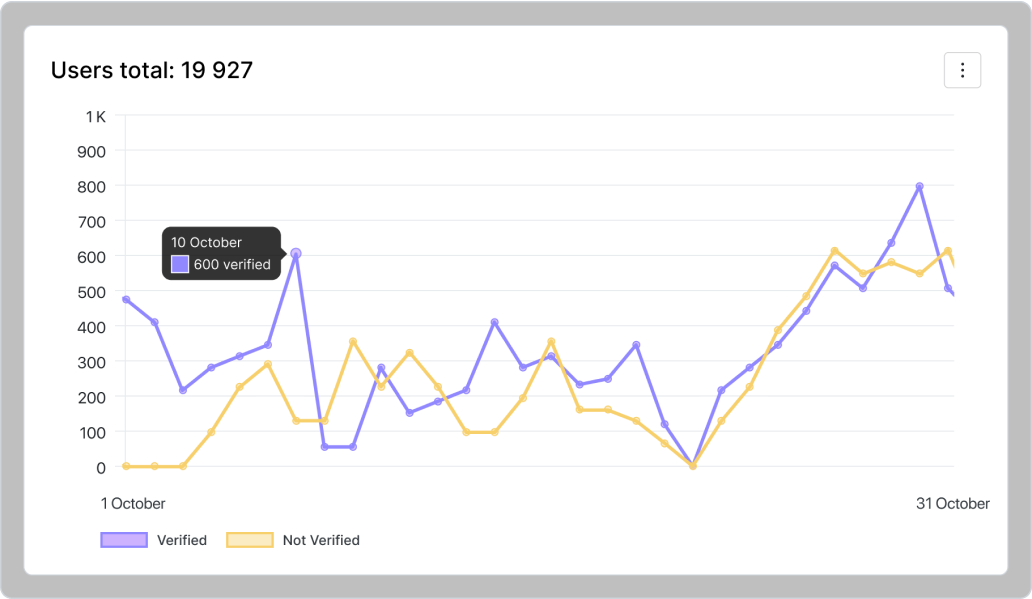
Users graph
It shows the dynamic changes in the number of your supporters over time. Different colors of graphs represent verified and unverified users.
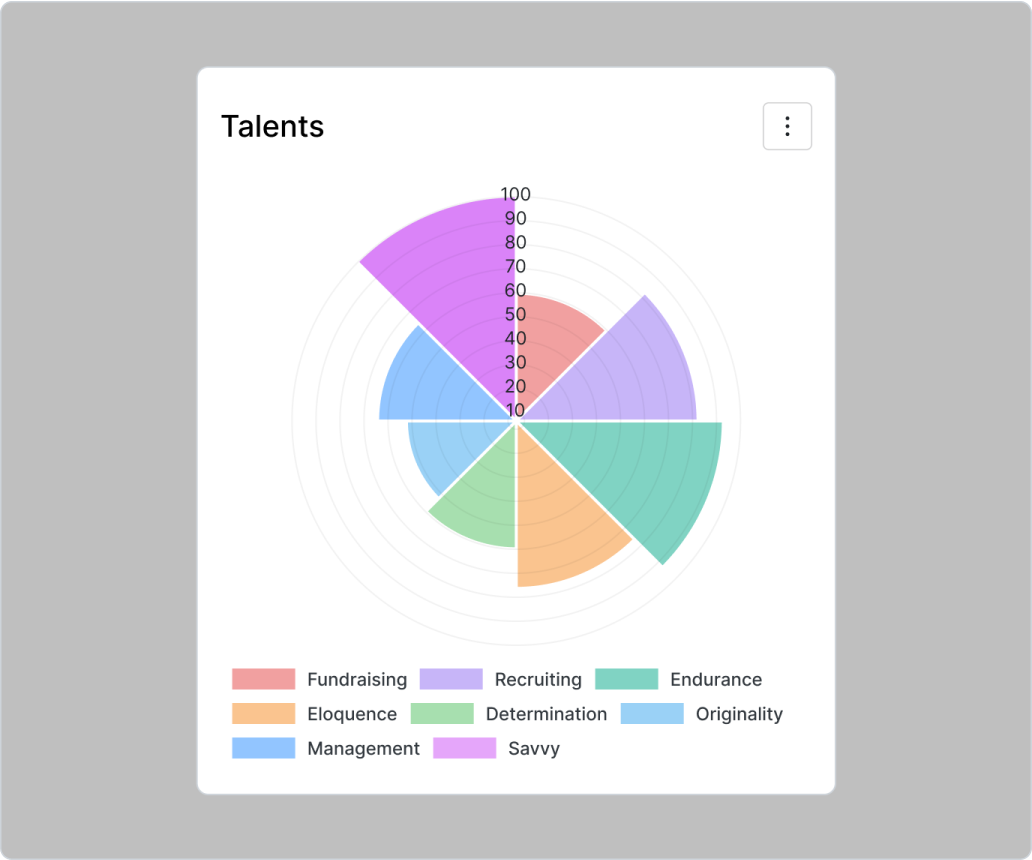
Talents graph
This graph shows the number of each talent point your supporters have in total. Using this data you can see which of the skills are more relevant to your supporters in general and use that information to craft more compelling and motivating quests for your supporters in the future.
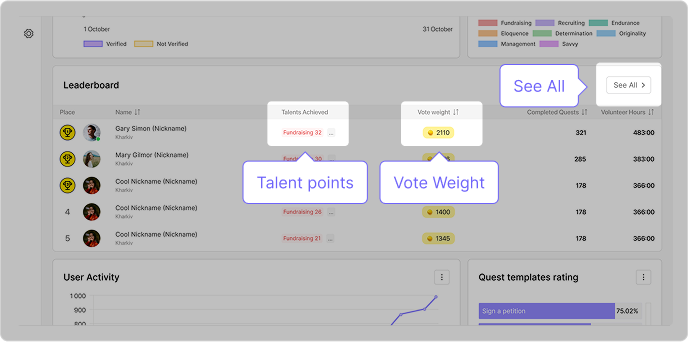
Leaderboard
This board shows the scoring of your supporters depending on their Vote Weight and Talent points. Leaderboards are one of the essential gamification tools for improving retention and user engagement.
You can view the complete leaderboard by clicking the “See All” button.
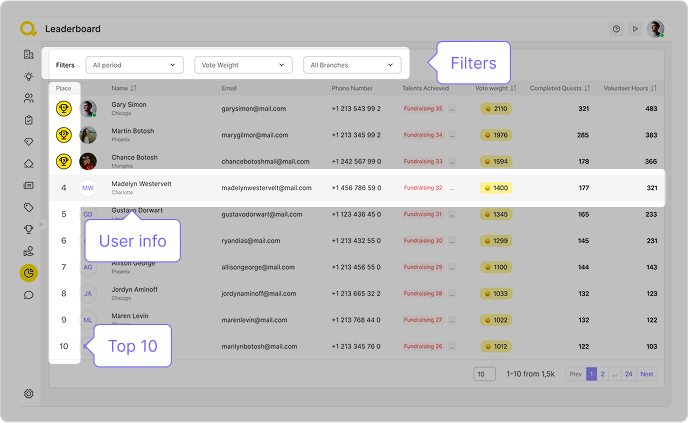
The graph shows the 10 supporters who are ranking the highest, along with their contact info and number of talent and Vote Weight points.
Use the filters at the top of the board to sort the list by time, Vote Weight/Talent points, or branches.
Clicking on a particular user will open their personal profile.
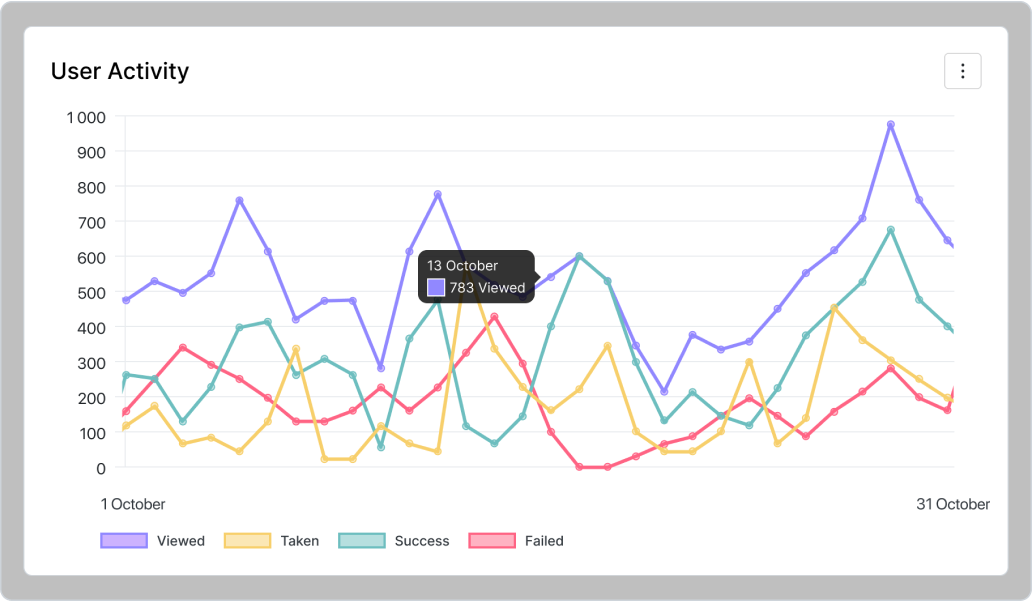
User activity
This graph shows you data about the number of quests that were viewed, assigned, failed, or completed over the chosen timeframe.
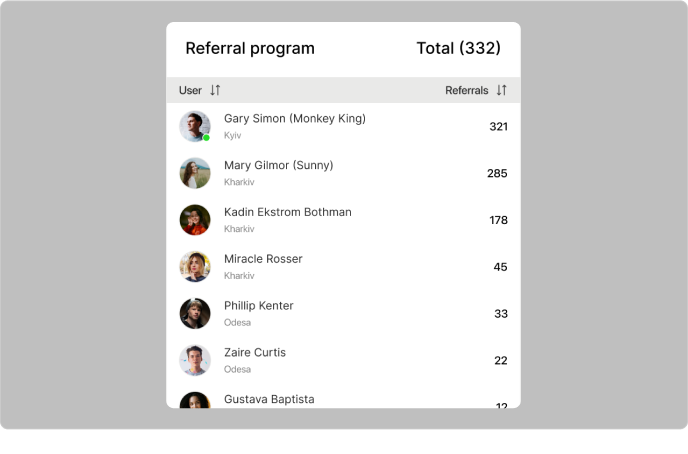
Referrals
Here, you can view the list of your supporters who have invited others to join your organization using a referral link. The number beside each name shows how many community members joined using that person’s link.
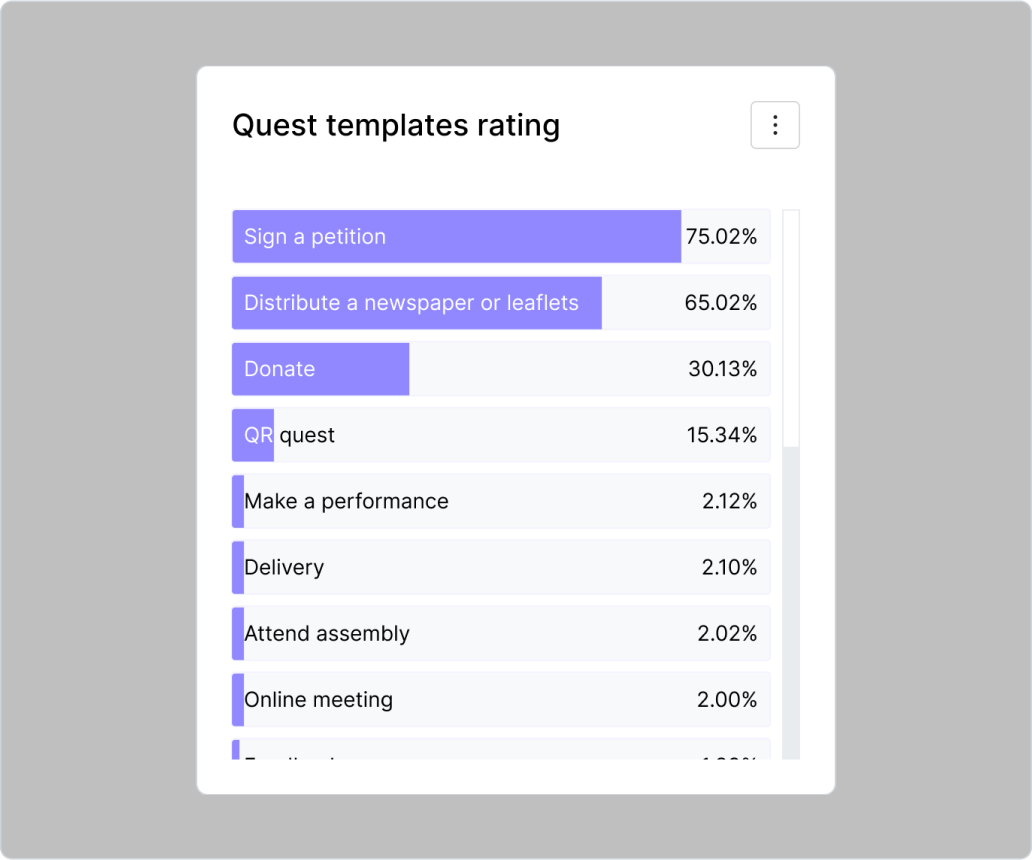
Quest template rating
Here you can see information about which of the quest templates that you have been using have been performing the best. The more people complete a quest, the more successful the algorithm thinks its template is. You can use this information to plan better and more interesting quests for your supporters.
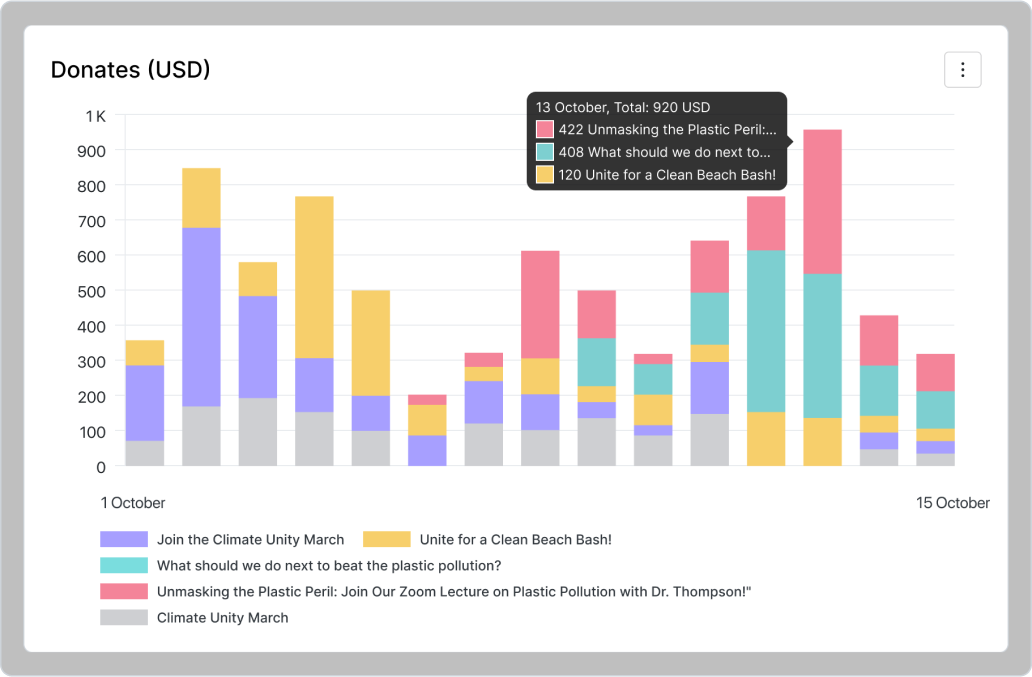
Donations
This graph shows the total amount of money that was donated to your organization over the chosen period of time.
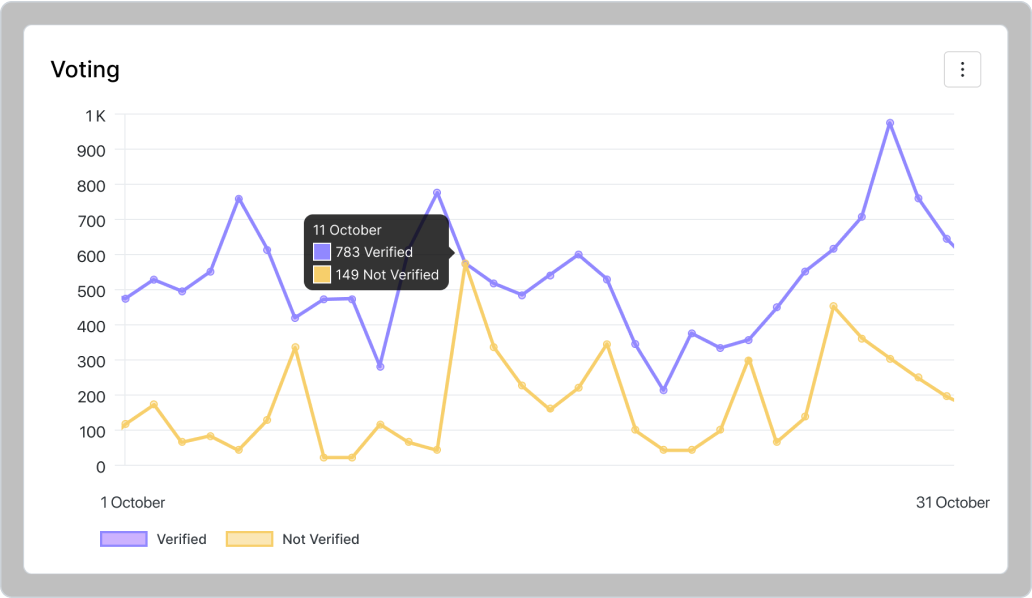
Voting
This graph shows you how many users (verified and unverified) have taken part in voting.
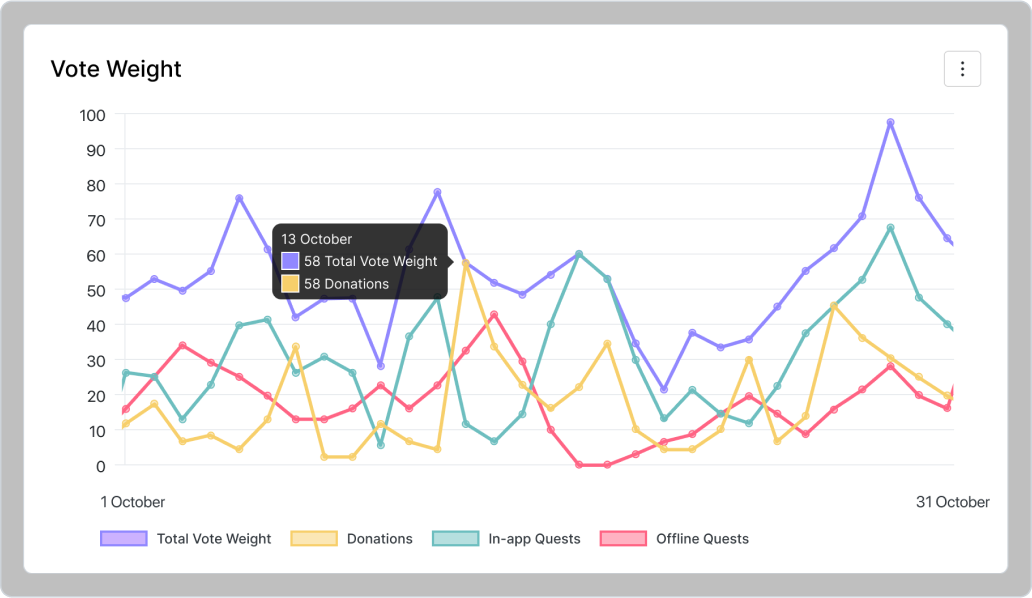
Vote Weight
The Vote Weight graph shows the fluctuation of the Vote Weight points number among your supporters over time.
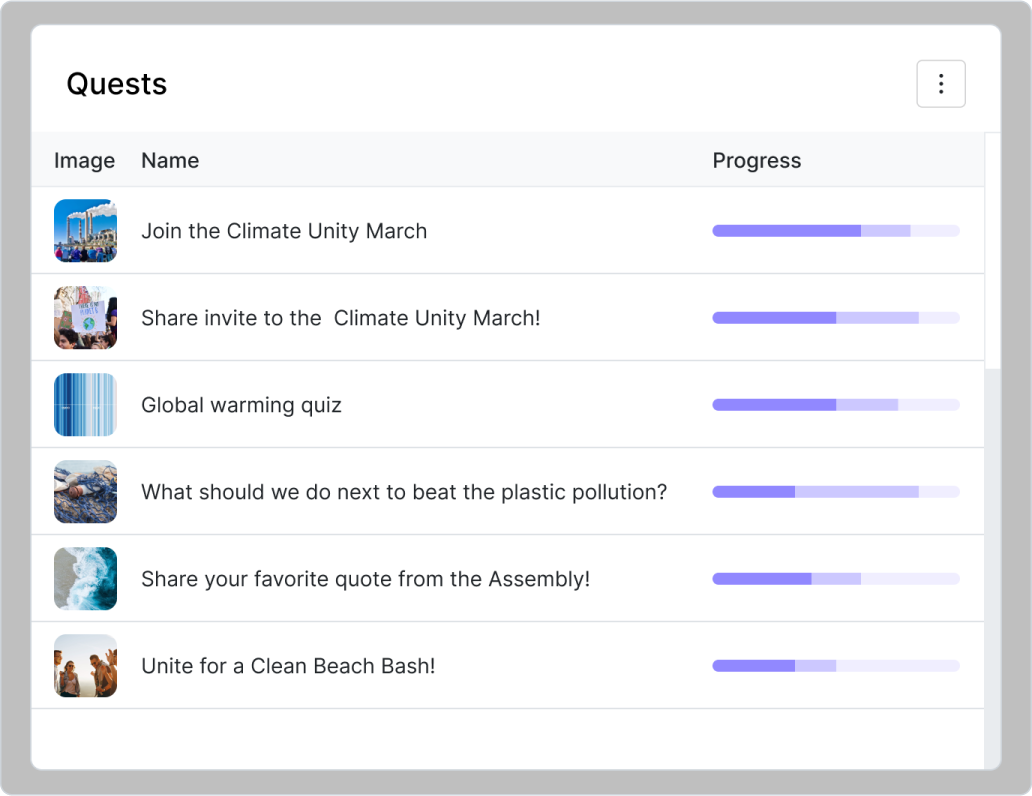
Quests
It’s a list of all your quests ranking them from the most successful to the least successful. The ranking is based on the ratio between the number of people who have signed up for a quest and the number of people who have completed it.
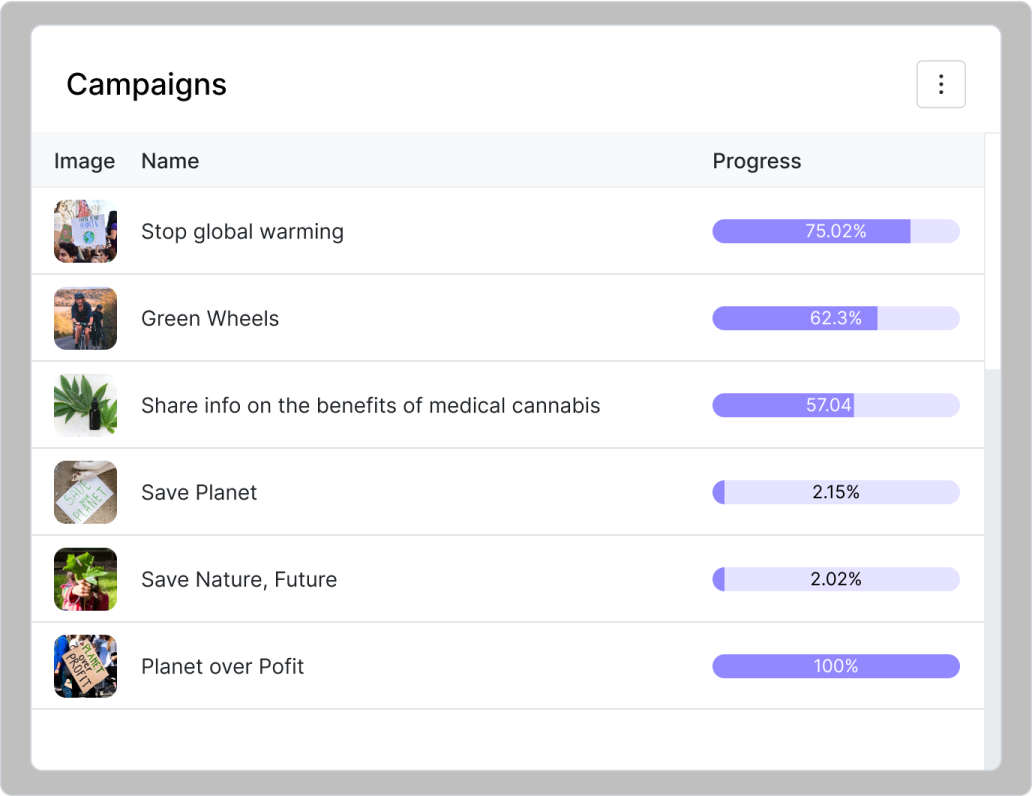
Campaigns
It’s a list of all your campaigns ranking them from the most successful to the least successful. The ranking is based on the ratio between the number of people who have signed up for a quest from a specific campaign and the number of people who have completed it.